The method
- Correlations: Calculation of Pearson correlation
coefficient between every pair of metrics available in order to
quantify their interrelationship degree. The score is in the range
[-1,1].
- Perfect correlations: -1 (negative), and 1 (positive)
- Stability: This analysis permits to estimate whether the
clustering is meaningfully affected by small variations in the data
[1]. First, a clustering using the k-means algorithm is carried out.
The value of K can be provided by the user. Then, the stability
index is the mean of the Jaccard coefficient [2] values of 1000
bootstrap replicates. The values are in the range [0,1], having the
following meaning:
- Unstable: [0, 0.60[
- Doubtful: [0.60, 0.75]
- Stable: ]0.75, 0.85]
- Highly Stable: ]0.85, 1]
- Goodness of classifications: The goodness of the classifications are assessed by validating the clusters generated. For this purpose, we use the Silhouette width as validity index. This index computes and compares the quality of the clustering outputs found by the different metrics, thus enabling to measure the goodness of the classification for both instances and metrics. More precisely, this measurement provides an assessment of how similar an instance is to other instances from the same cluster and dissimilar to all the other clusters. The average on all the instances quantifies how appropriately the instances are clustered. Kaufman and Rousseeuw [3] suggested the interpretation of the global Silhouette width score as the effectiveness of the clustering structure. The values are in the range [0,1], having the following meaning:
- There is no substantial clustering structure: [-1, 0.25].
- The clustering structure is weak and could be artificial: ]0.25, 0.50].
- There is a reasonable clustering structure: ]0.50, 0.70].
- A strong clustering structure has been found: ]0.70, 1].
[2] Jaccard, C. (1901). Distribution de la flore alpine dans le Basin de Dranses et dans quelques regions voisines. Bulletin de la Societe Vaudoise des Sciences Naturelles, 37, 241–272.
[3] Kaufman, L. and Rousseeuw, P. (1990). Finding Groups in Data: An Introduction to Cluster Analysis. Wiley.
Data input
- The input is a CSV file. Format information;
- Column delimiter: ","
- Decimal separator: "."
- The first row is the header. The first column of the header is the ID or name of the instance of the dataset (e.g., ontology, pathway, etc.) on which the metrics are measured. The rest of the columns of the header contains the names of the metrics. The rest of rows contains the measurement of the metrics for each instance in the dataset.
- Minimum requirements and limitations
- Analysis of correlations: the input file must contain at least two metrics for the analysis of correlations.
- The user has to select the number of clusters (K) to be created by the k-means algorithm. Our current implementations uses the same value of K for all the metrics. Please ensure that the number of different measurements for each metrics is larger than K. If you wish to use different values of K for different metrics, please split your input file into several ones.
- The bootstrapping method applied for the calculation of the stability may fail if the number of different measurements for a metric is close to K. If this happens, please try with a lower value of K.
Aliquot,RIN,DegFact
1,9,4.9
2,8.5,4.8
3,8.3,5.5
4,8.1,5.2
5,8.1,5
6,7.9,6.9
7,7.8,6.1
8,7.3,6.8
9,6.4,13.1
10,6.3,11.6
11,6.2,12.3
12,5.5,16.6
13,4.7,16.1
14,4.6,22.3
15,4,26
16,2.5,30.5
Data output
The web service provides different kind of outputs, depending on how it is invoked:
"","DegFact","RIN"
"DegFact",1,-0.974468501362178
"RIN",-0.974468501362178,1Example of CSV for the stability: The columns are the name of the metric, the stability scores for the K clusters and the mean stability score
Metric,Stability_category_1,Stability_category_2,Stability_category_3,Stability_category_4,Stability_category_5,Mean_stability
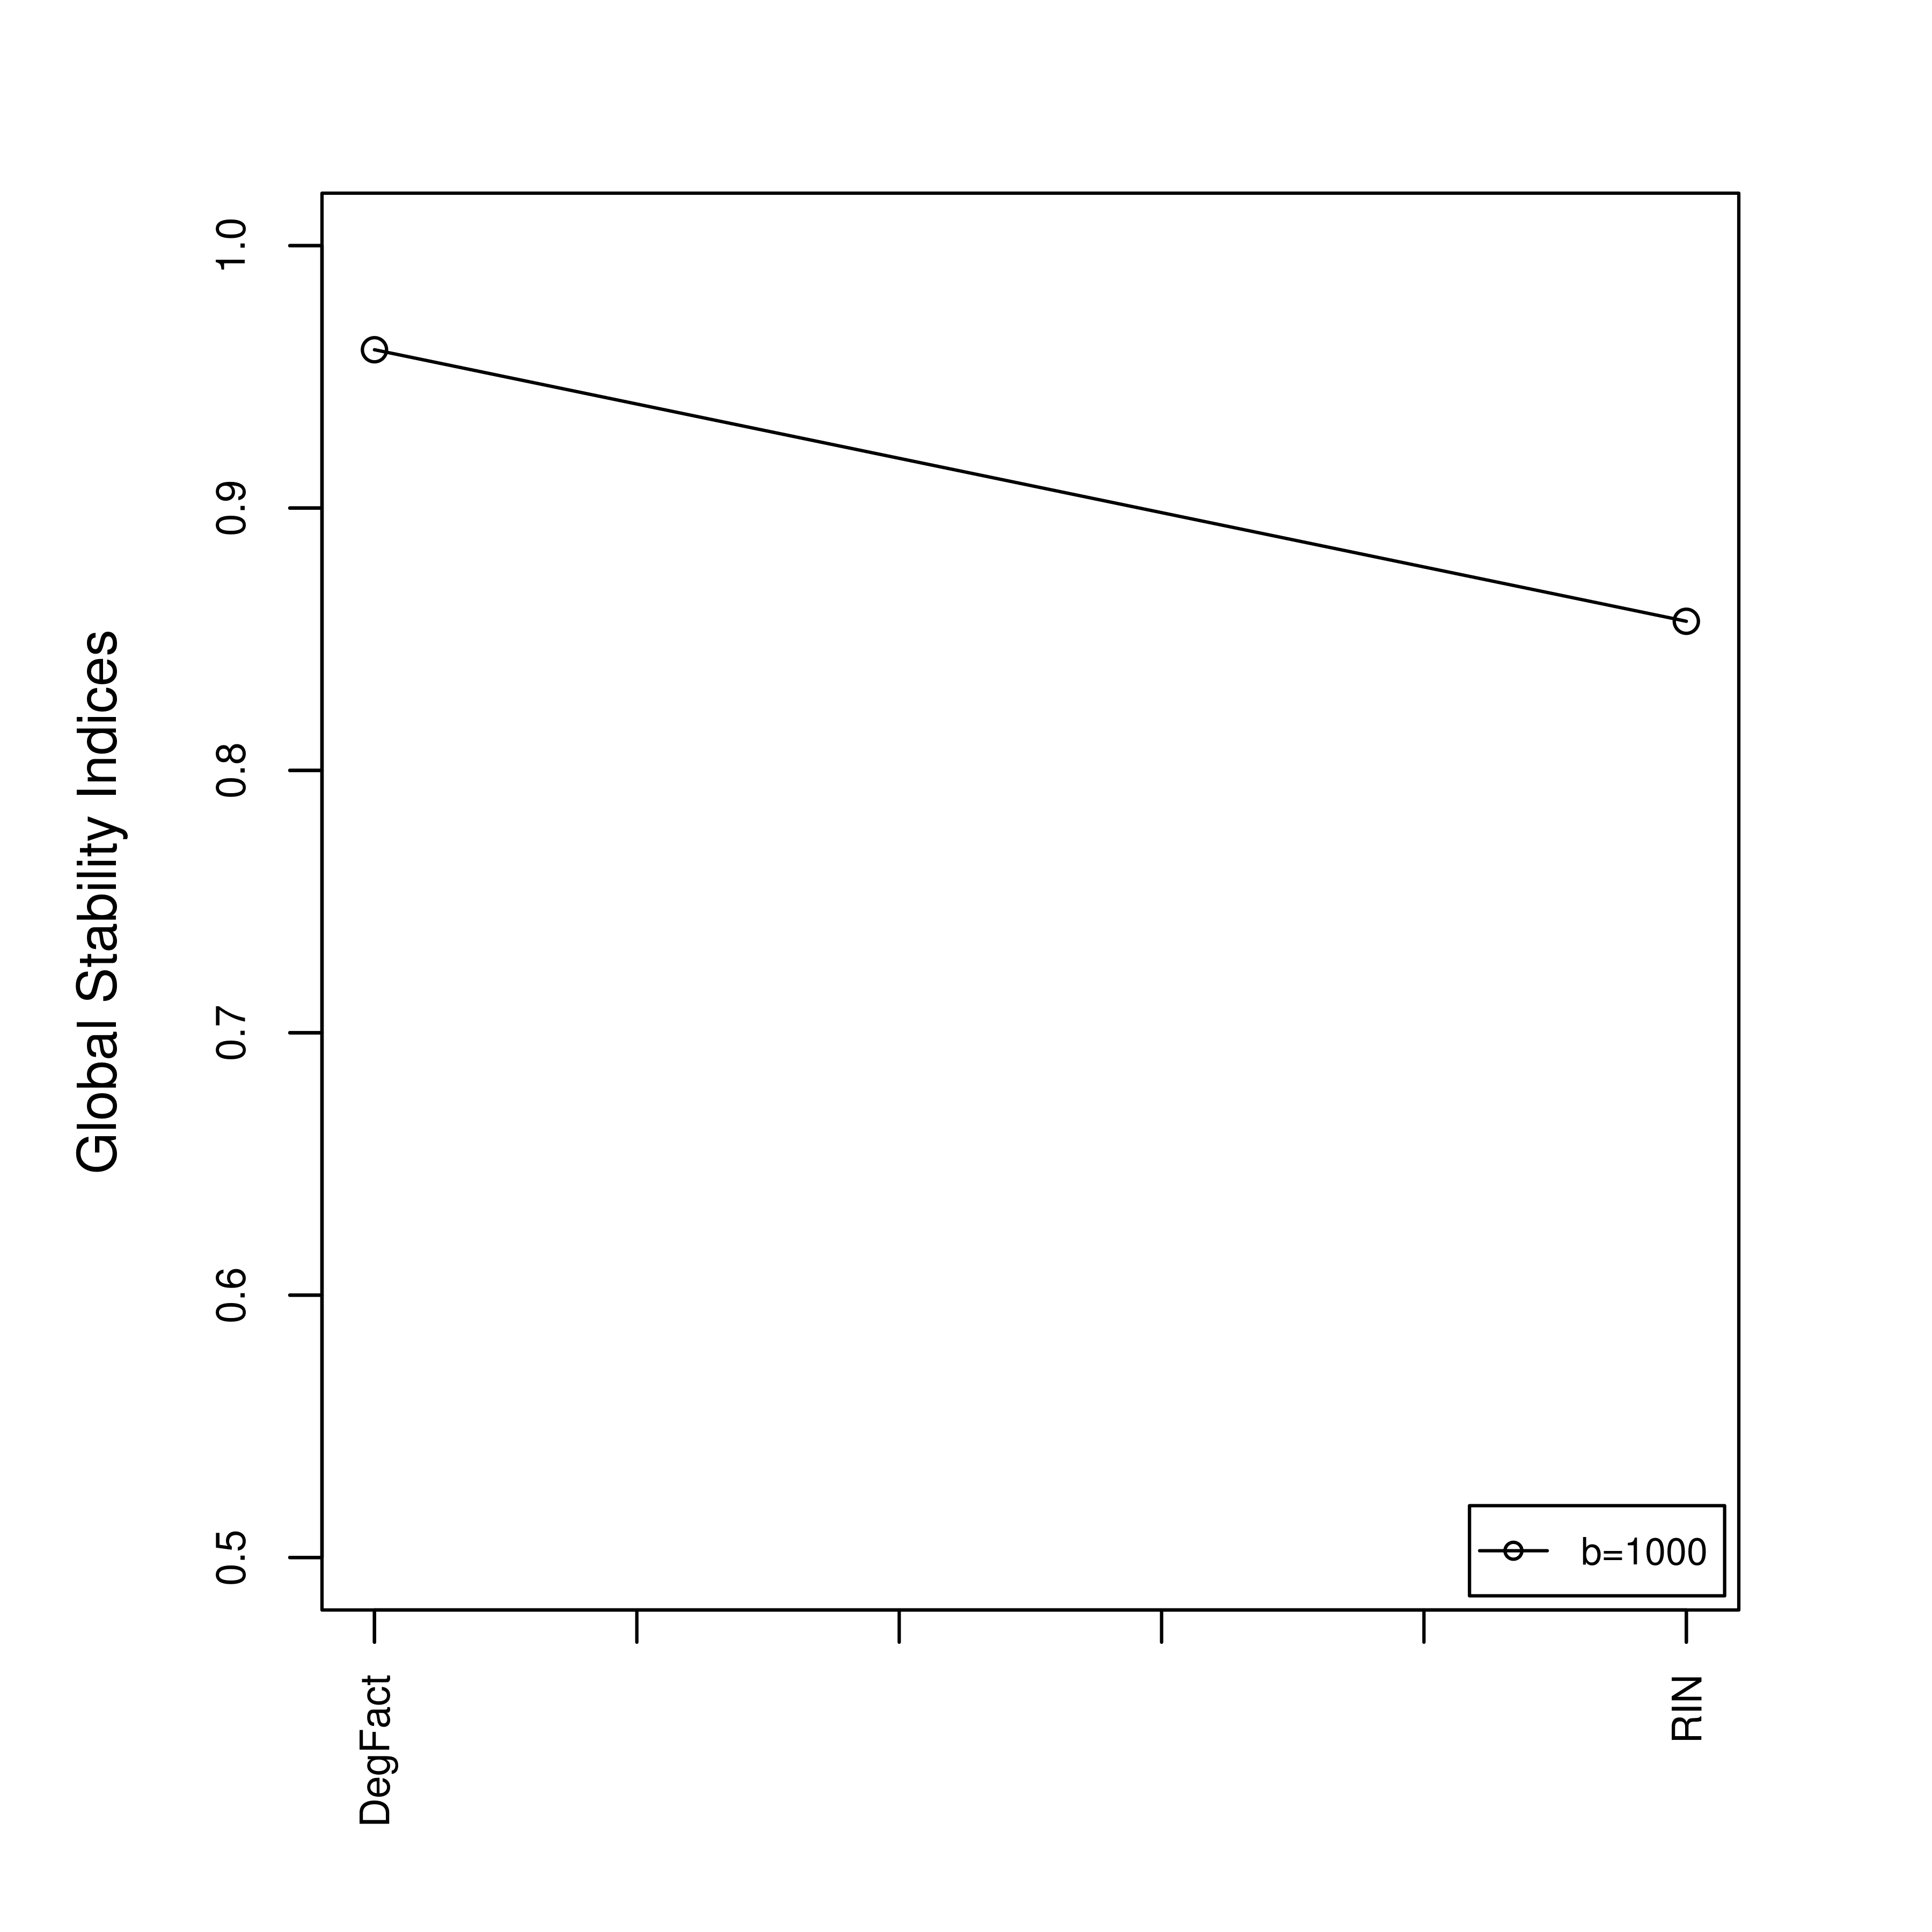
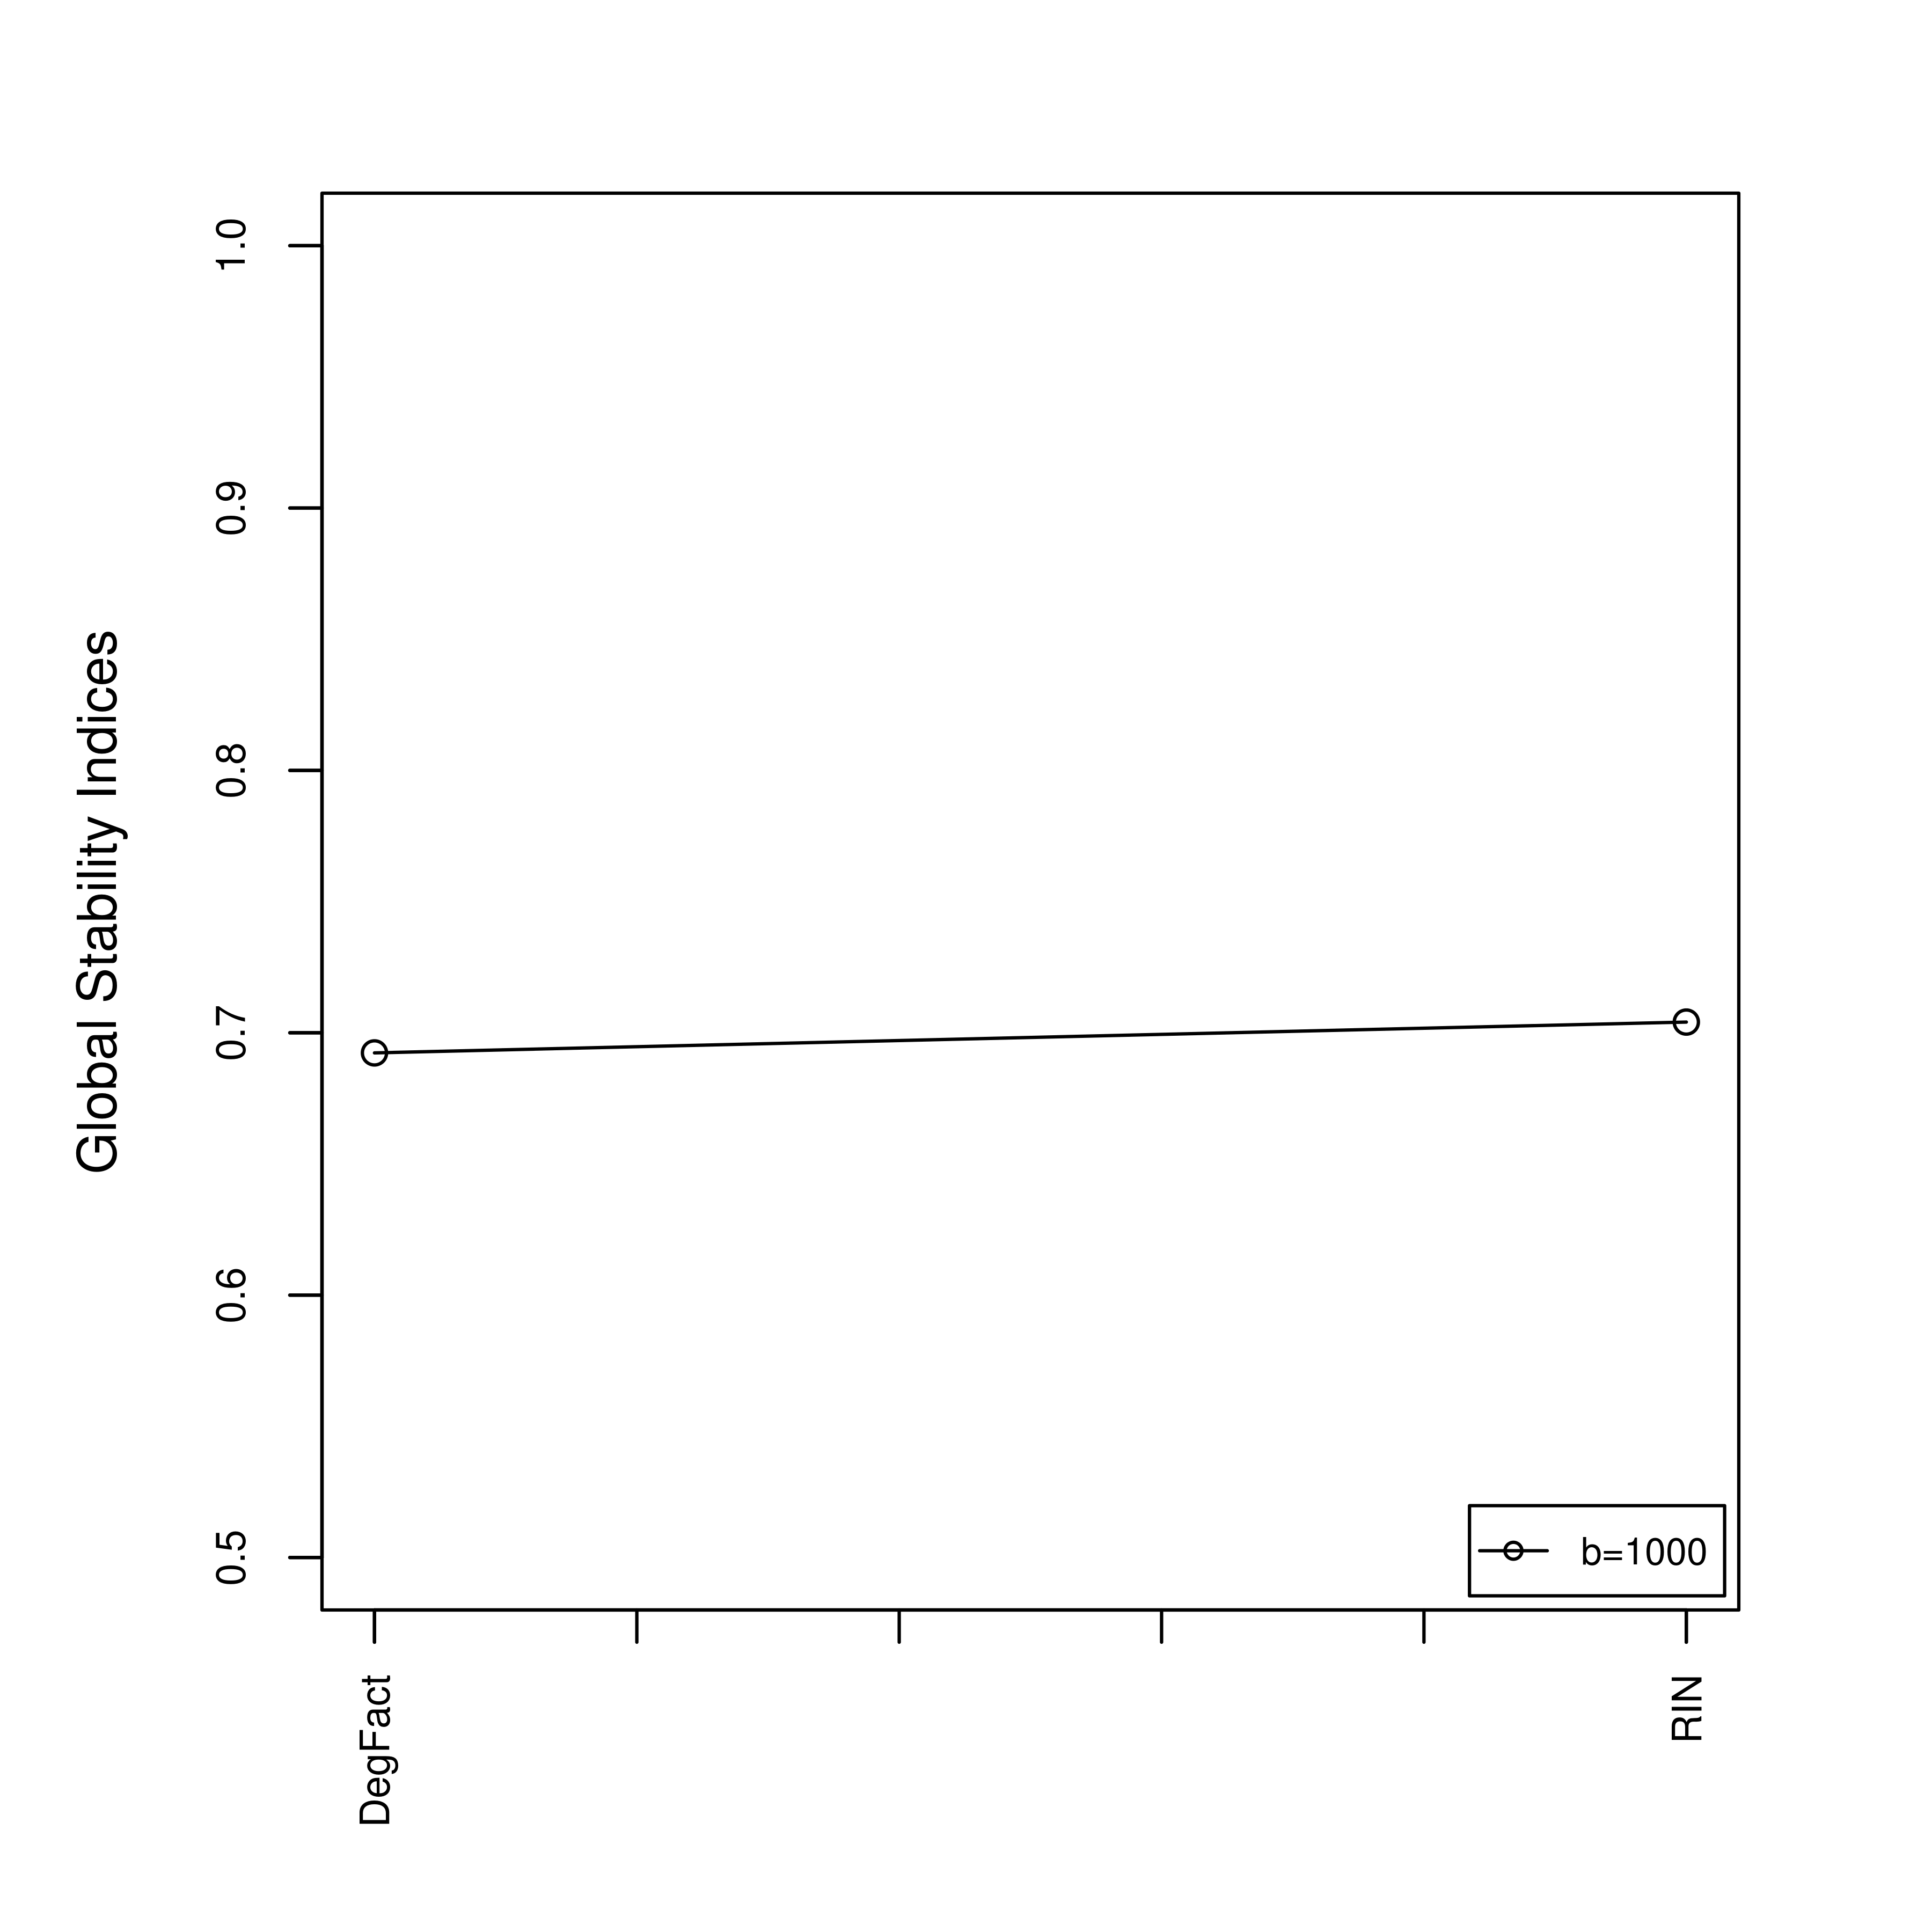
DegFact,0.7483333333333333,0.43483333333333335,0.6331666666666667,0.842,0.8033333333333333,0.6923333333333334
RIN,0.5866666666666667,0.8023333333333333,0.8226666666666667,0.632,0.6767380952380952,0.7040809523809524Metric,Cluster_1_SilScore,Cluster_2_SilScore,Cluster_3_SilScore,Cluster_4_SilScore,Cluster_5_SilScore,Avg_Silhouette_Width,Cluster_1_Size,Cluster_2_Size,Cluster_3_Size,Cluster_4_Size,Cluster_5_Size
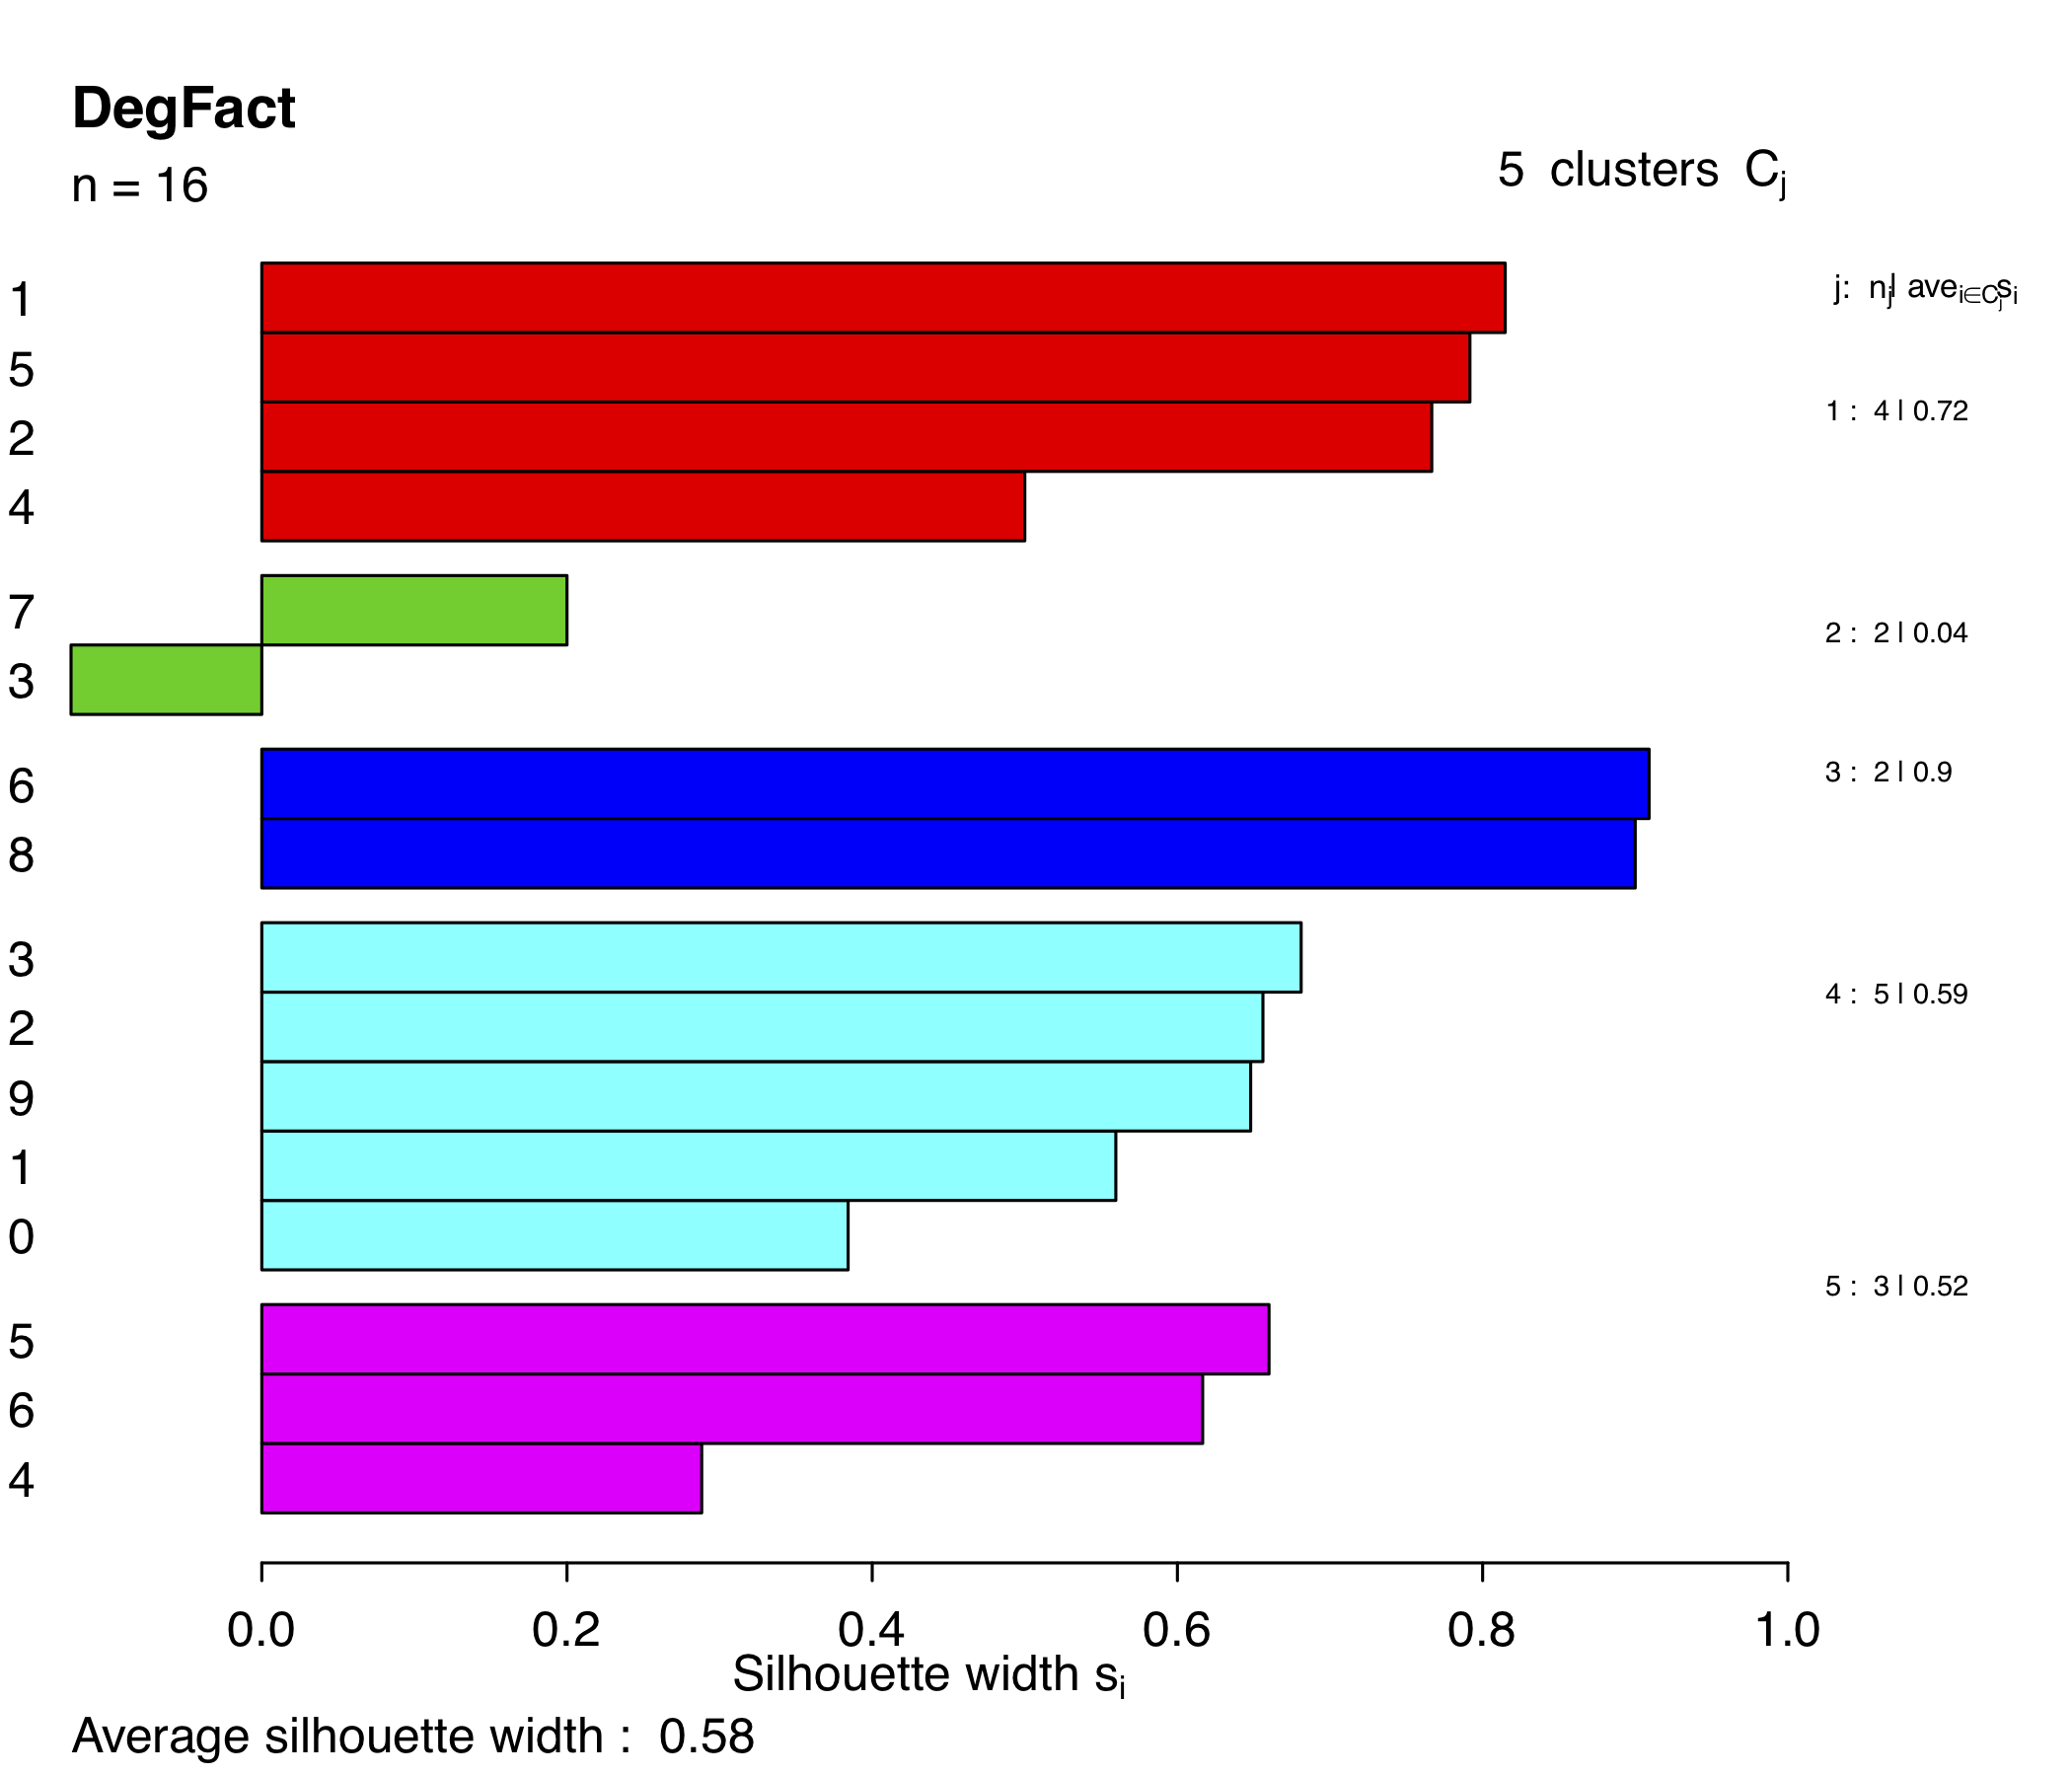
DegFact,0.718287037037037,0.0375000000000007,0.904545454545454,0.585791823535685,0.521618857725795,0.591246,4,2,2,5,3
RIN,0,0.682539682539682,0.615758840004668,0.433333333333333,0.348714574898785,0.5282413,1,3,4,3,5Example of output format (extracted from our use case on RNA quality metrics).
- CSV file and images with the results of the analysis of correlations
- CSV file and images with
the results of the analysis of stability of the metrics (k=5)
- CSV file and images with the results of the analysis of the goodness of the classifications of the metrics (k=5)
- CSV file and images with
the results of the analysis of stability of the metrics (k=3)
- CSV file and images with the results of the analysis of the goodness of the classifications of the metrics (k=3)
Comparison of stability of the metrics using K=3 (left) and K=5 (right)
The metrics are highly stable with k=3, but are doubtful with k=5.
This means that applying these metrics is more effective on
this dataset when trying to classify the instances in three groups
than in five ones.
 |
 |
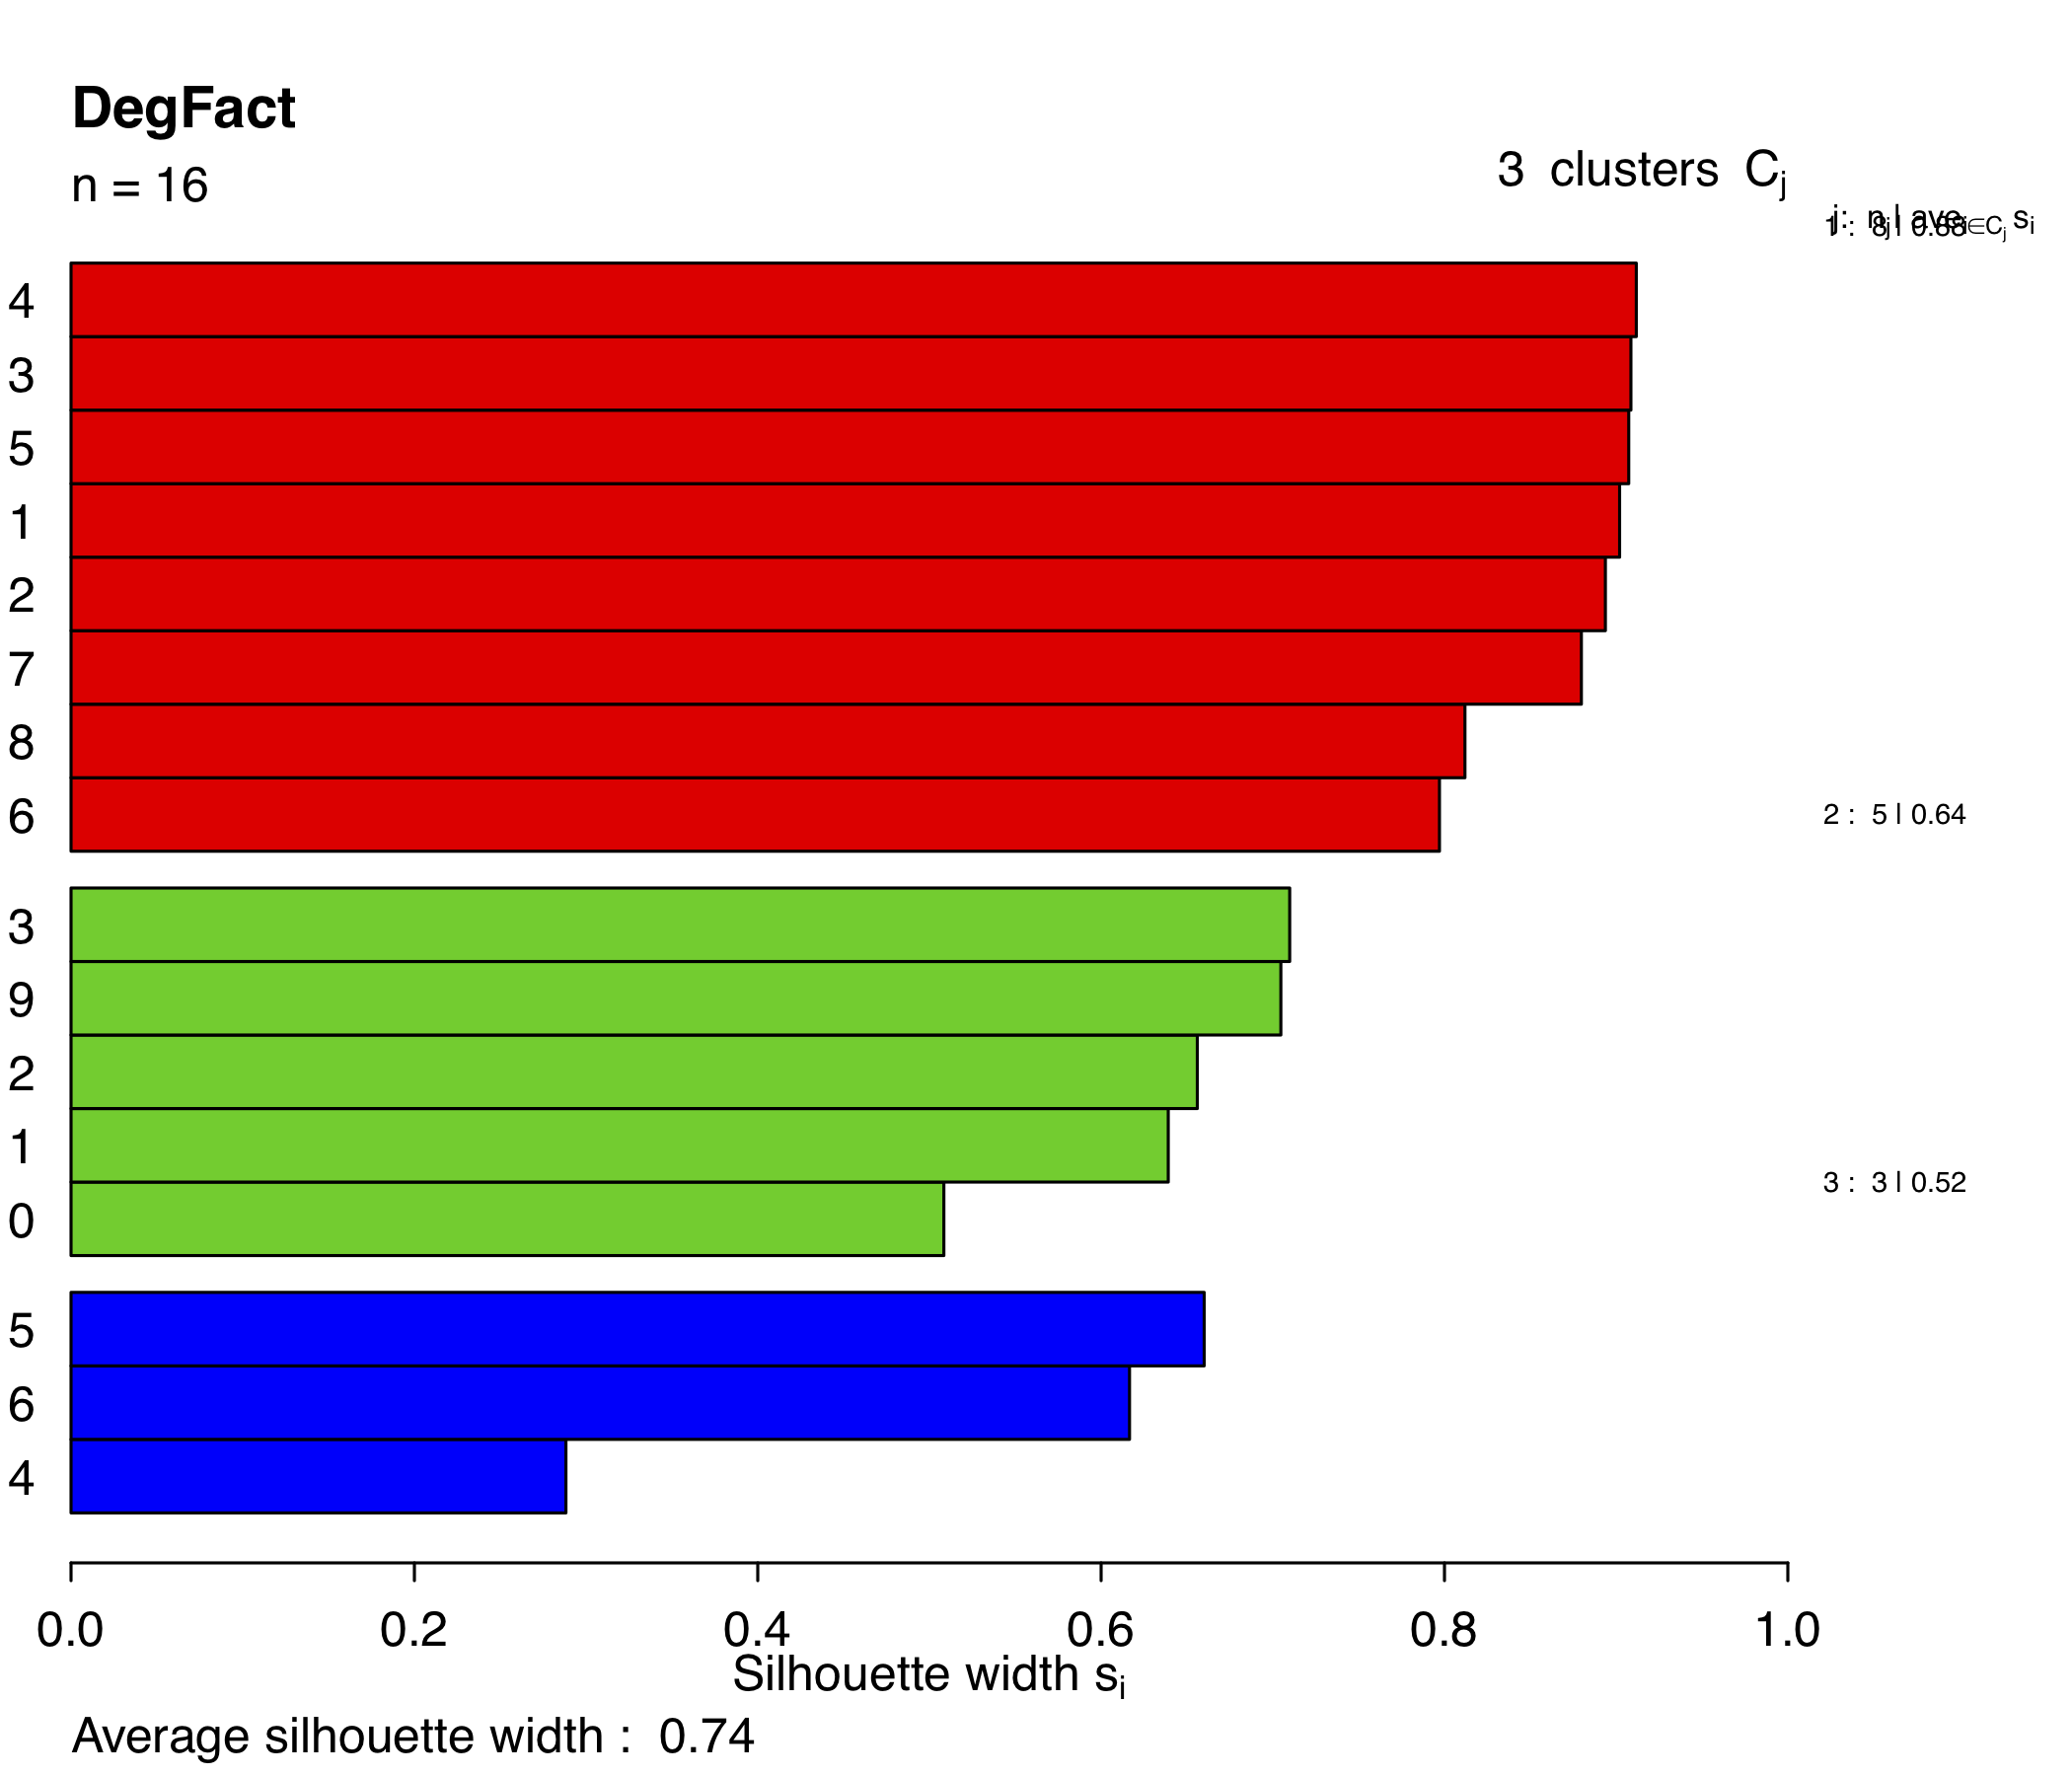
The silhouette width for k=3 is 0.74 which means that it has a strong structure, whereas the structure is reasonable with K=5 (score 0.58). Using K=3 is more appropriate for this metric.
 |
 |
The REST API
The documentation of the REST API is available in our API page.
Browser Compatibility
The online interface has been successfully tested in the following web browsers on desktop computers.
| Google Chrome |
Safari | Mozilla Firefox | Microsoft Edge | |
| Windows 10 |
71.0.3578.98 | Not tested | 64.0 | 2.17134.1.0 |
| Linux (Ubuntu 18.04) | 68.0.3440.106 | Not tested | Quantum | Not tested |
| Mac OS 10.13.6 |
71.0.3578.98 | 12.0.2 | 64.0 |
Not tested |